Spectra of Flaring Active Regions
by Brandon Panos
In this chapter we will explore how the spectral line associated with once ionized Magnesium (Mg II) behaves during a solar flare. To do this, we will make use of one of the most celebrated classical machine learning algorithms known as the k-means algorithm, to conjointly analyze slit-jaw images (SJI) and spectra collected by the Interface Region Imaging Spectrograph (IRIS).
This chapter draws heavily on the functionality provided by IRISreader, a library constructed for the purposes of supporting machine learning exploration on data collected by IRIS. The contents presented in this chapter are hosted on Github and are reflections of the publication Panos et al, 2018, ApJ, 806, 14 .
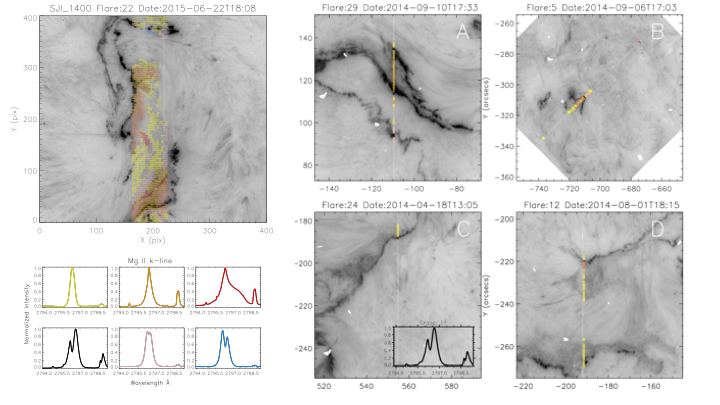 Example of the k-means learning algorithm applied to several different flares. The emergent spectra are color coded in accordance to which group (lower left panel) they are most similar to.